Open source / Apache-2.0 · Self-hosted ◆ Alpha
The observability platform
that can actually fix things, safely.
eBPF traces, logs, metrics and a live service map for your Kubernetes cluster — no SDKs, no code changes. And when something breaks, a built-in AI SRE investigates and fixes it through named, reversible action pipelines. No shell. No kubectl. No YAML it could hallucinate.
- bring your own LLM
- air-gapped capable
- no SDKs, no sidecars
- outbound-only agent
Three things you don't get anywhere else
1
Traces for services you never instrumented
One outbound-only agent plus an eBPF DaemonSet (OTel eBPF Instrumentation). HTTP/gRPC spans with cross-service context propagation — including compiled Go binaries — plus SQL, Redis and Kafka client spans.
- No SDKs, no sidecars, no code changes
- An ERROR log line is two clicks from the distributed trace
- PromQL on the real Prometheus engine, embedded, on ClickHouse
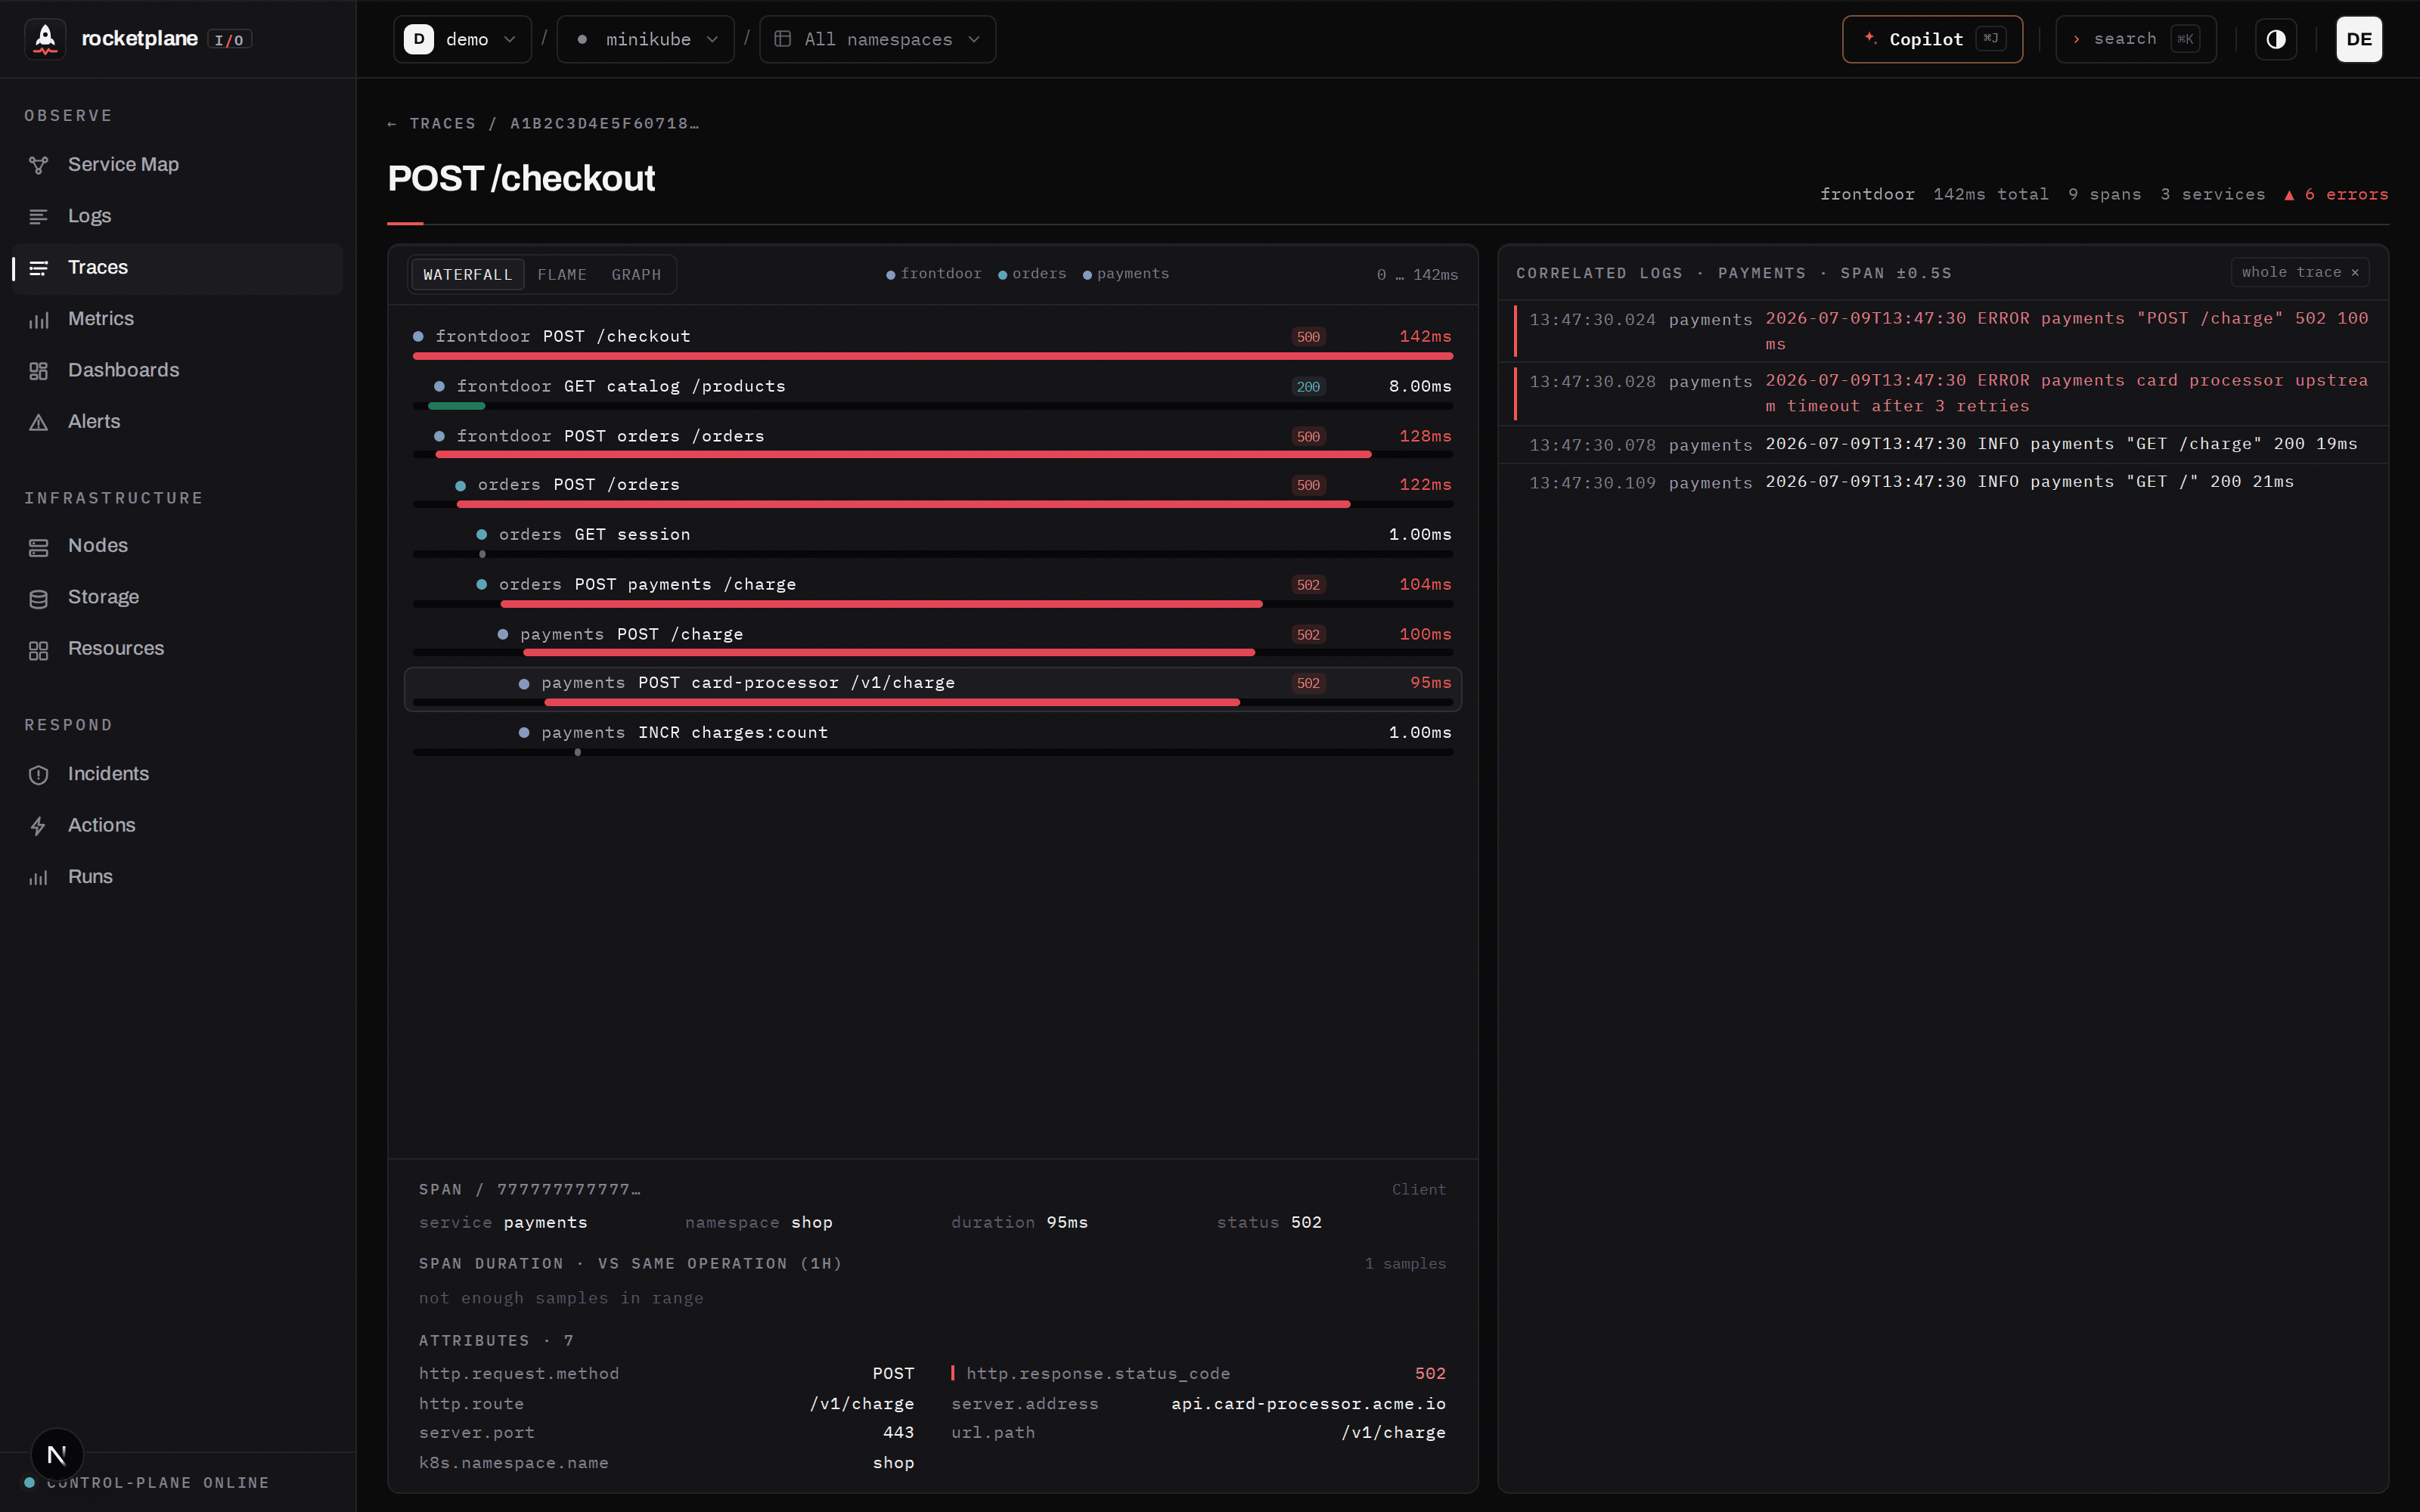
GET /checkout: the failure cascades frontdoor → checkout → catalog, exact ERROR lines correlated on the right. No SDK in any of these services.2
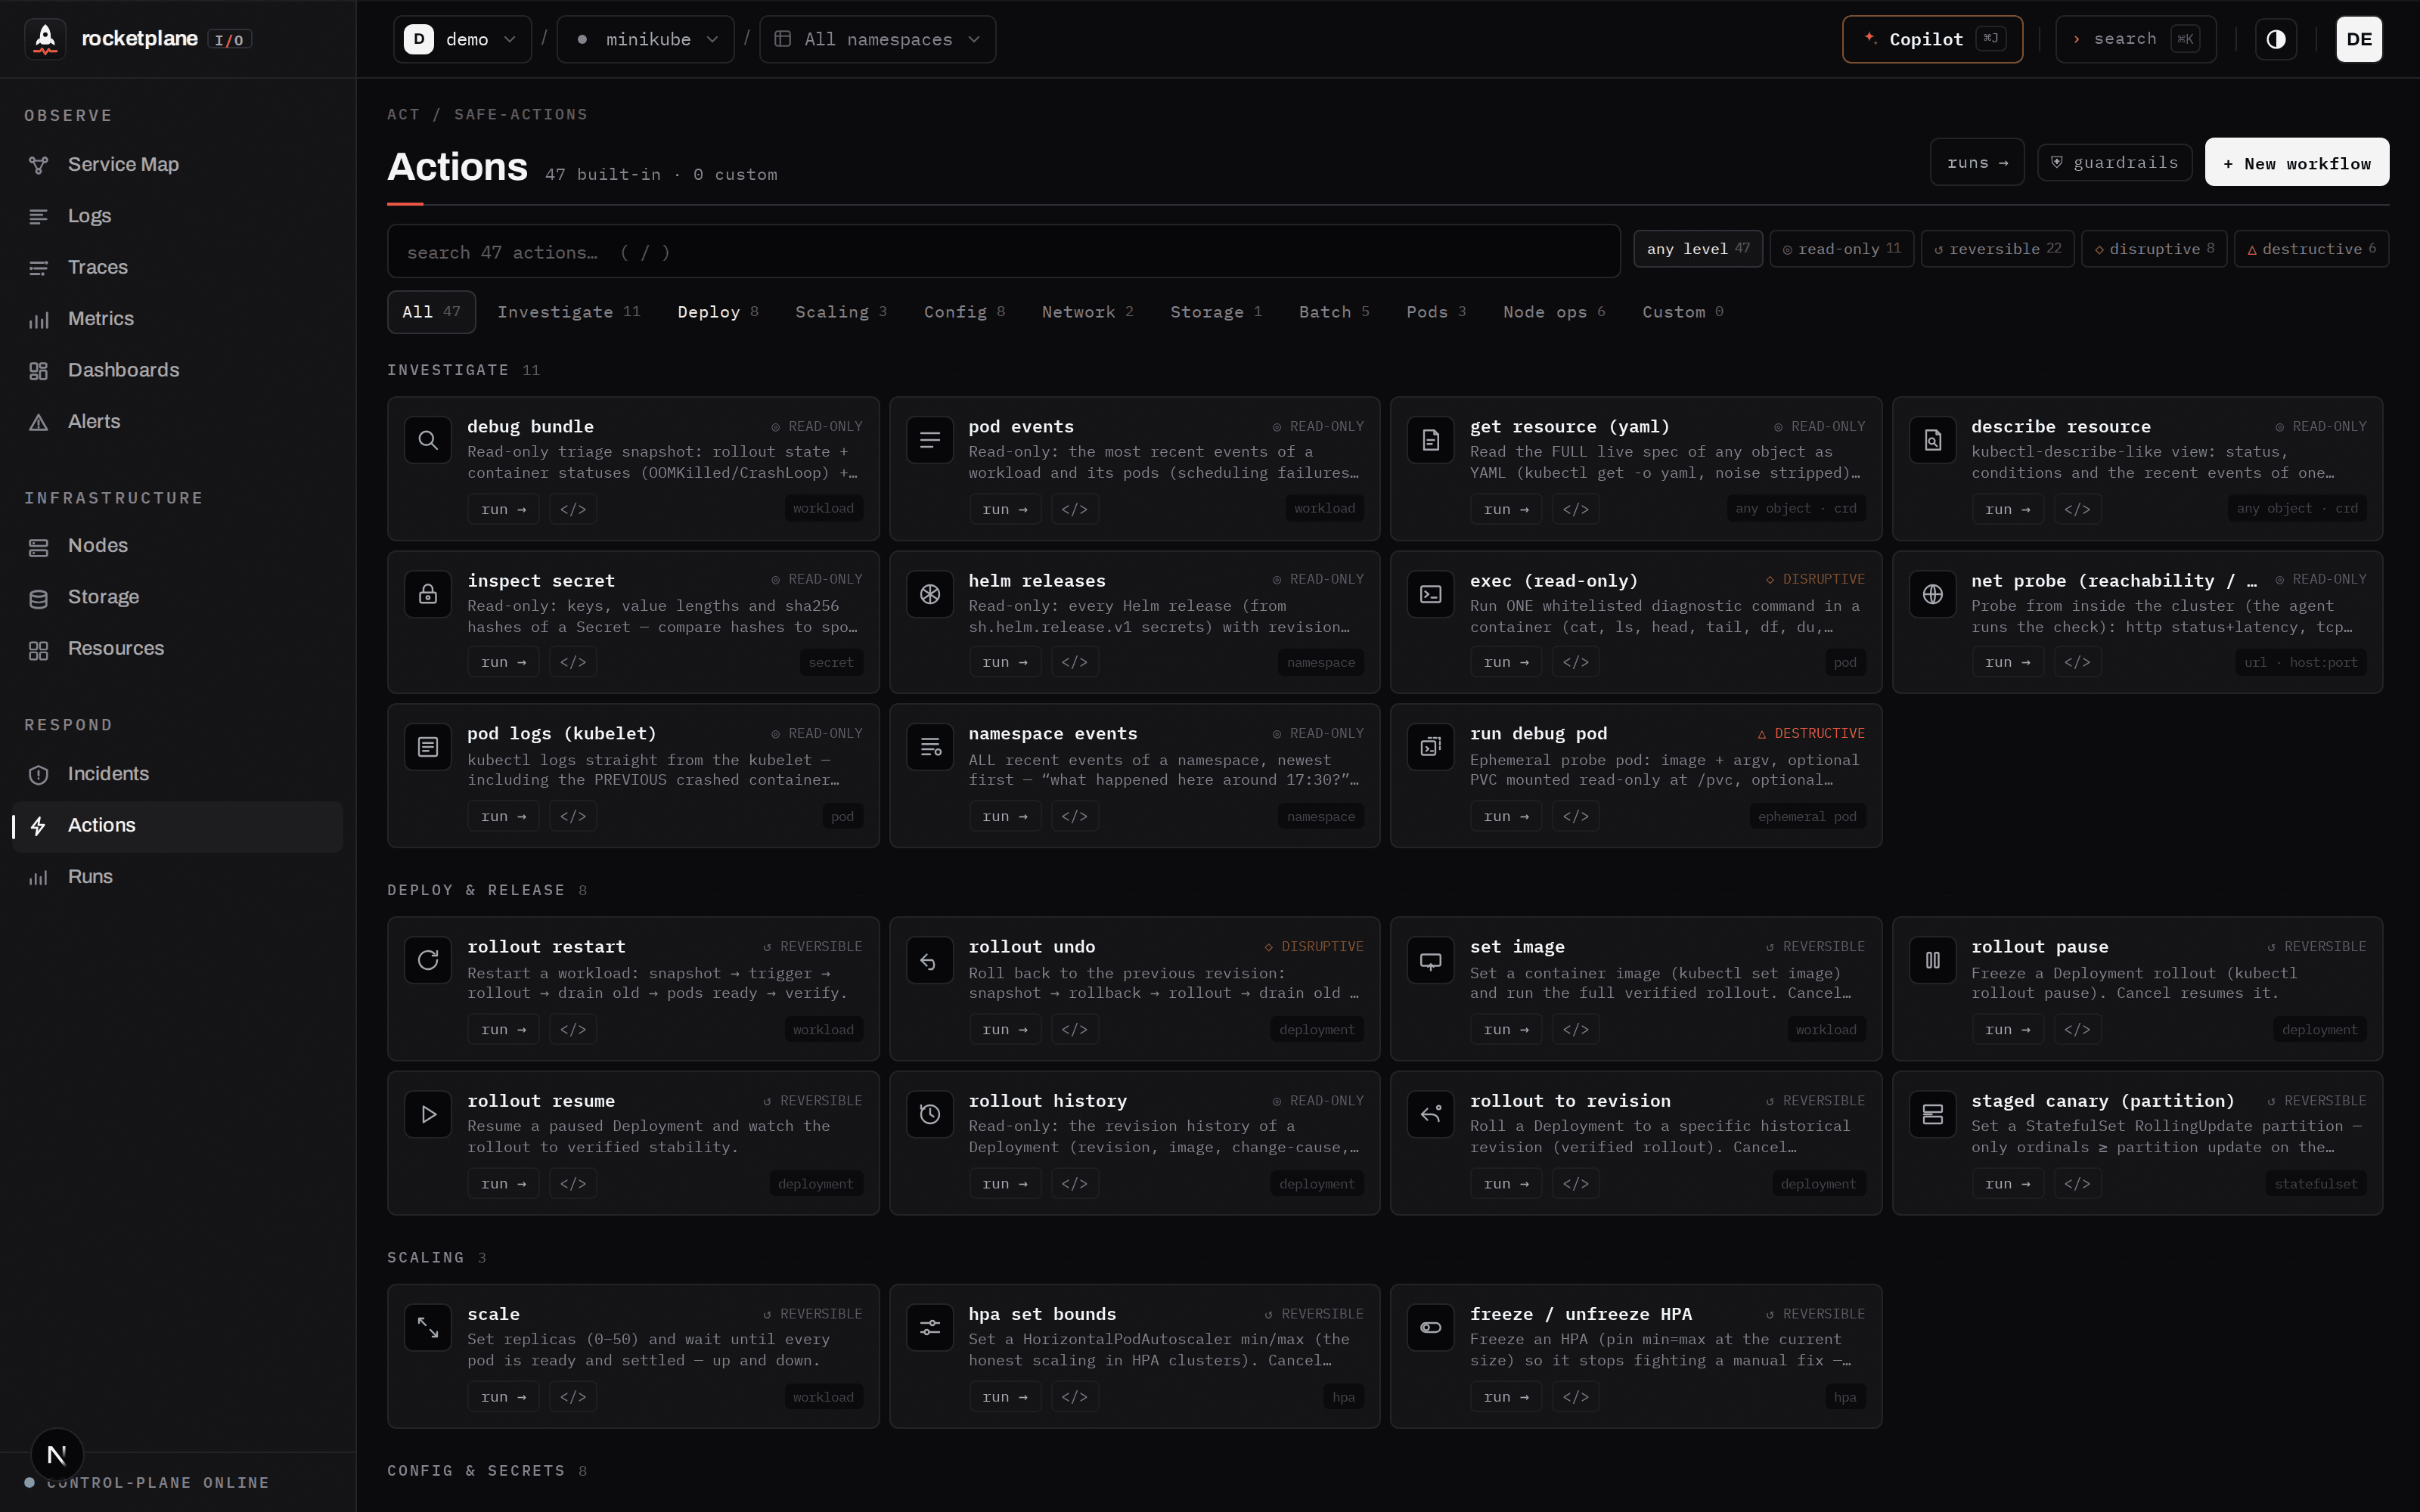
An AI SRE with a safety catalog — not an AI with kubectl
Every action the Copilot can take is a named, typed, risk-graded pipeline.
Risk is parameter-aware — scale replicas=3 is reversible,
replicas=0 is destructive — scope is enforced server-side, and
you set the approval rule per level.
| Level | Examples | Default approval |
|---|---|---|
| ◎ read-only | debug bundle, rollout history, drain preview | runs automatically |
| ↺ reversible | scale up, restart, set image, config edits | one click |
| ◇ disruptive | evict pod, rollout undo, cleanup | one click |
| △ destructive | drain, scale-to-0, NoExecute taint | type the target's name to arm |
The model proposes. Deterministic pipelines execute, verify at pod level, and roll back.
The LLM never touches the cluster directly.
3
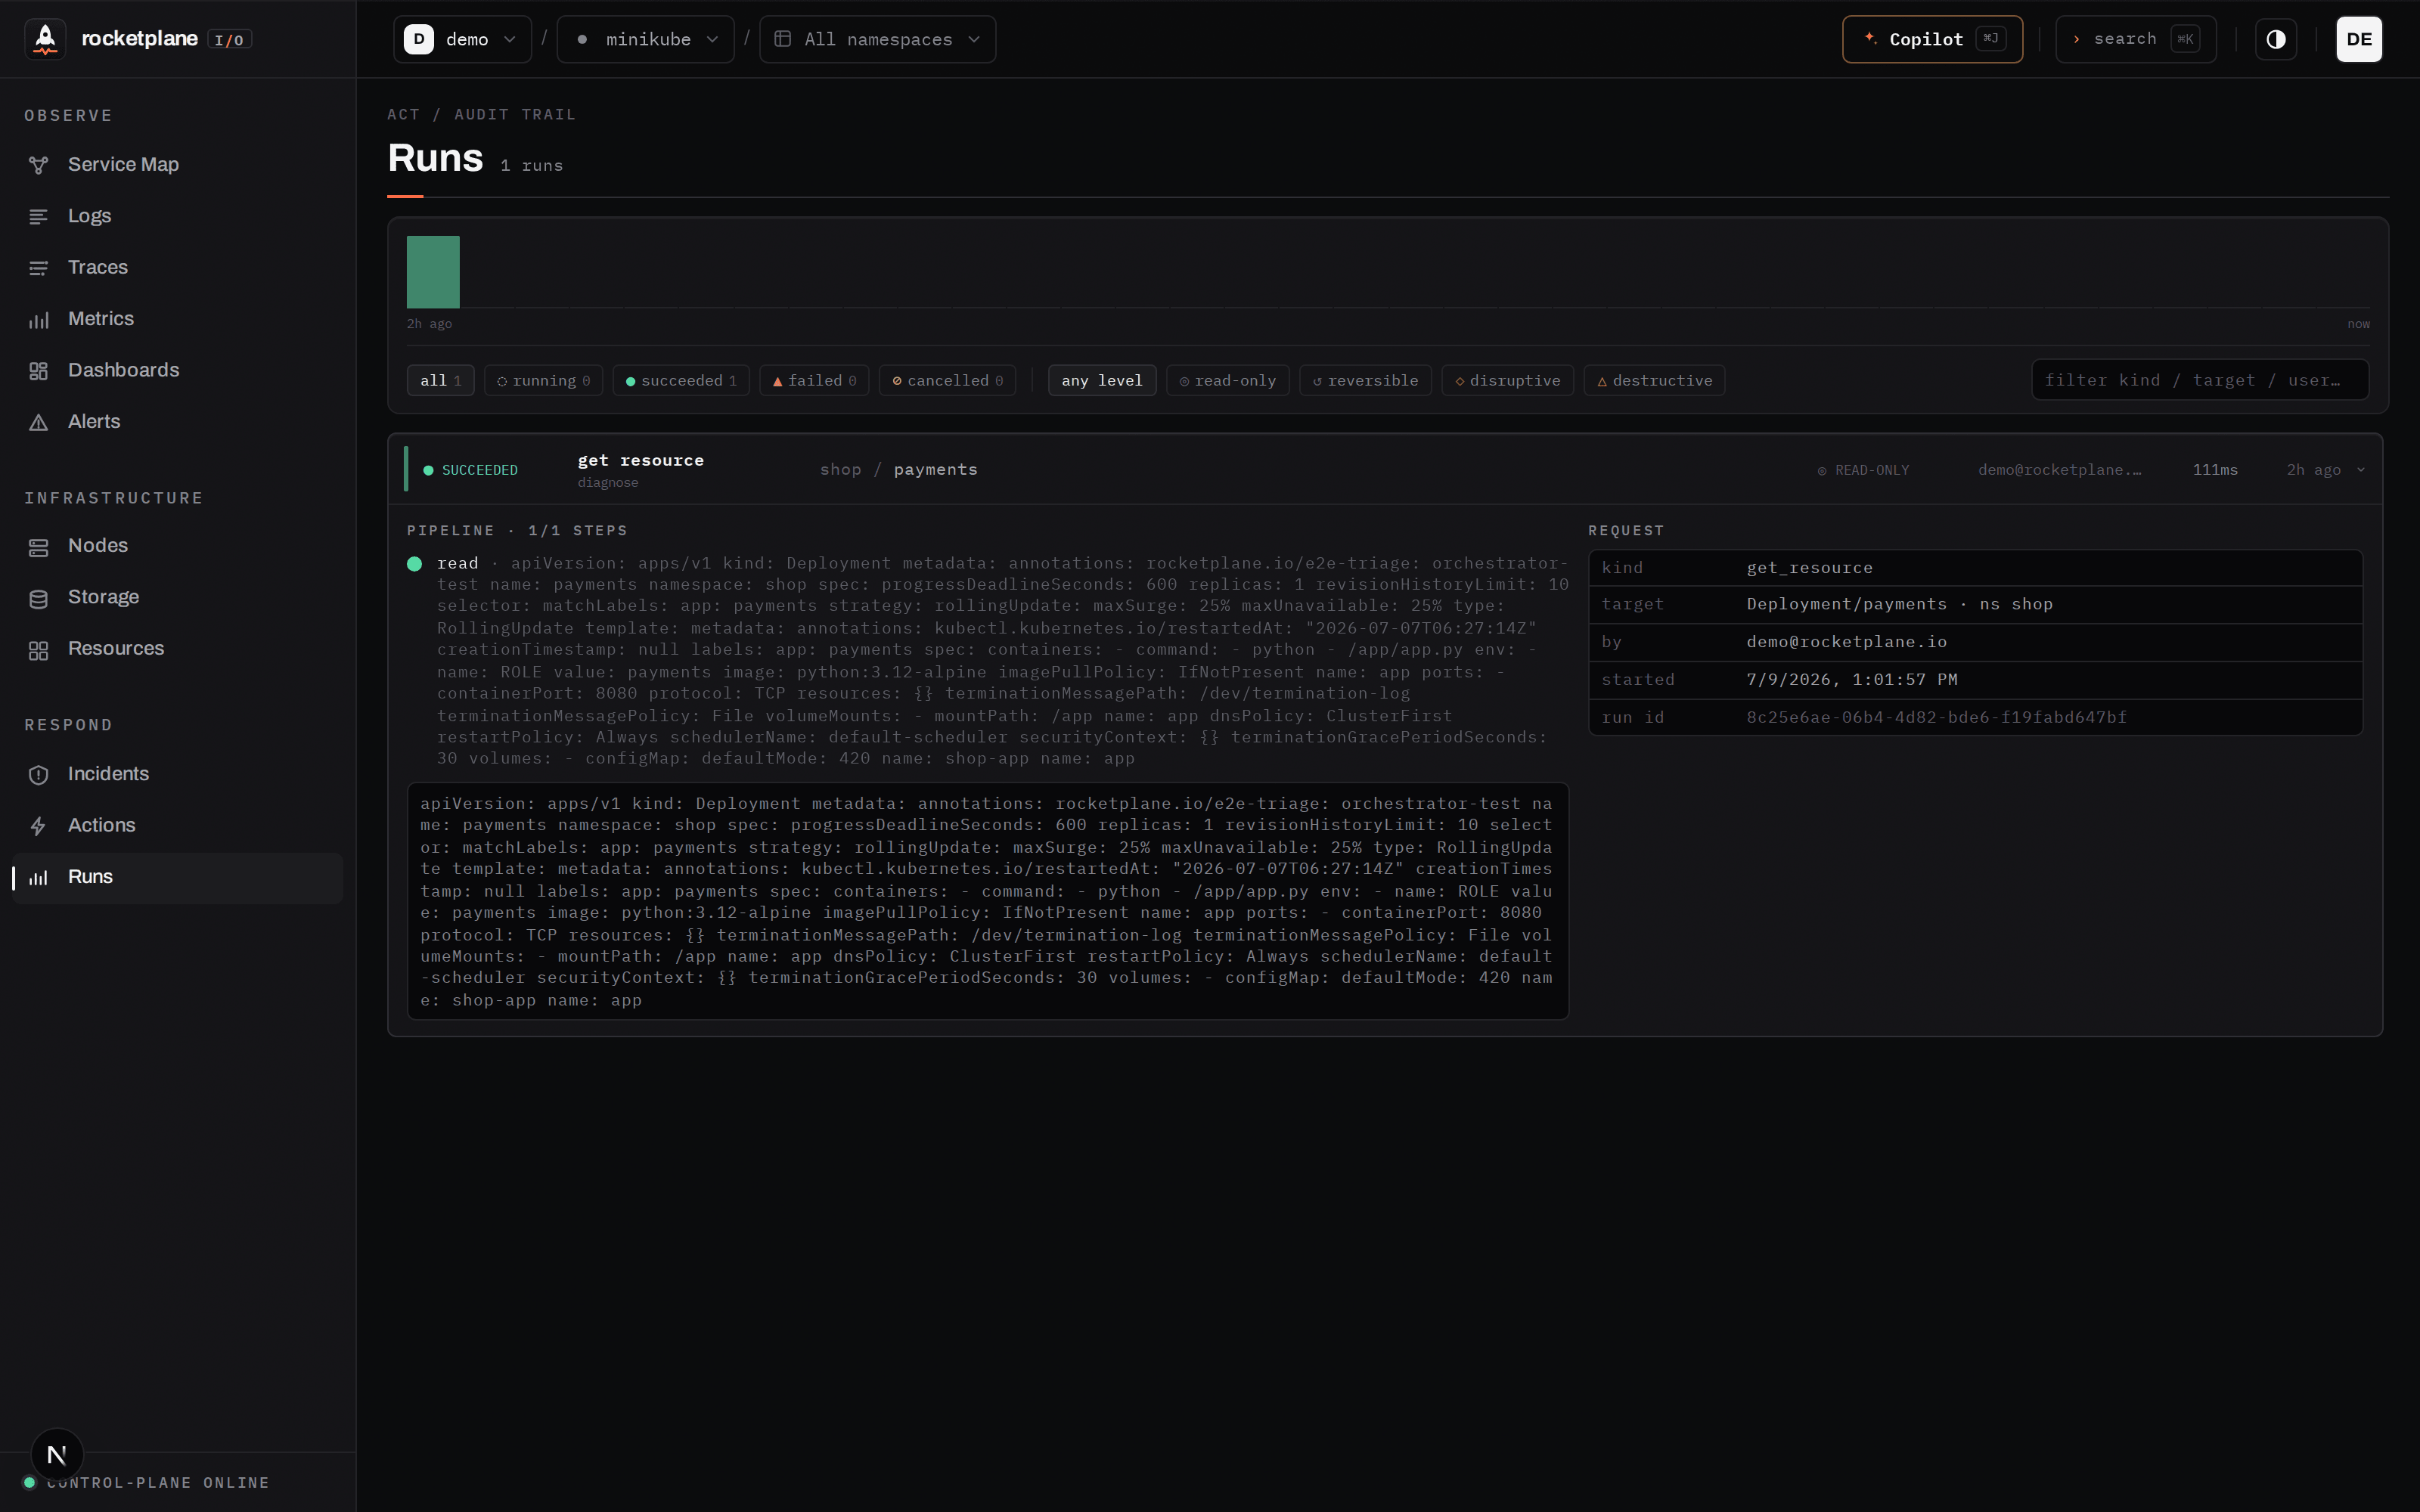
Every change proves itself — or undoes itself
Actions aren't fire-and-forget kubectl calls. Each one is a pipeline — trigger→observe→verify — that only reports success when the cluster actually converged: old pods gone, new pods Ready, stable.
- Snapshot taken before every mutation
- Cancel or timeout → automatic rollback from the pre-mutation snapshot
- ↺ revert: one click re-applies the exact prior state
The section every platform team reads first
Outbound-only
The agent dials out over HTTPS. Nothing connects into your cluster, nothing listens. Actions are claimed by the agent — never pushed in.
Enumerated RBAC, two blocks
observe is read-only; act holds exactly the write verbs the catalog needs. Delete the act block for a strictly observe-only agent. No wildcards, no cluster-admin.
Secrets stay secret
The inventory shows names, types and key counts — never values. Enforced in agent code; enforce it with RBAC too and the agent degrades gracefully.
The LLM is caged
It reads through the same authenticated APIs you use, and mutates only via the whitelisted, validated, risk-gated catalog. Every proposal, approval and result lands in the audit trail.
Your data stays yours
Bring any Anthropic- or OpenAI-compatible model — including a fully local, air-gapped one. Telemetry never leaves your infrastructure either way.
Tiny footprint
The agent is one pod at ~2m CPU / ~10Mi cluster-wide. Beyla scales with request volume — ~0.02–0.25 core, ~280Mi per node, bounded.
A full observability cockpit, not just a chat window
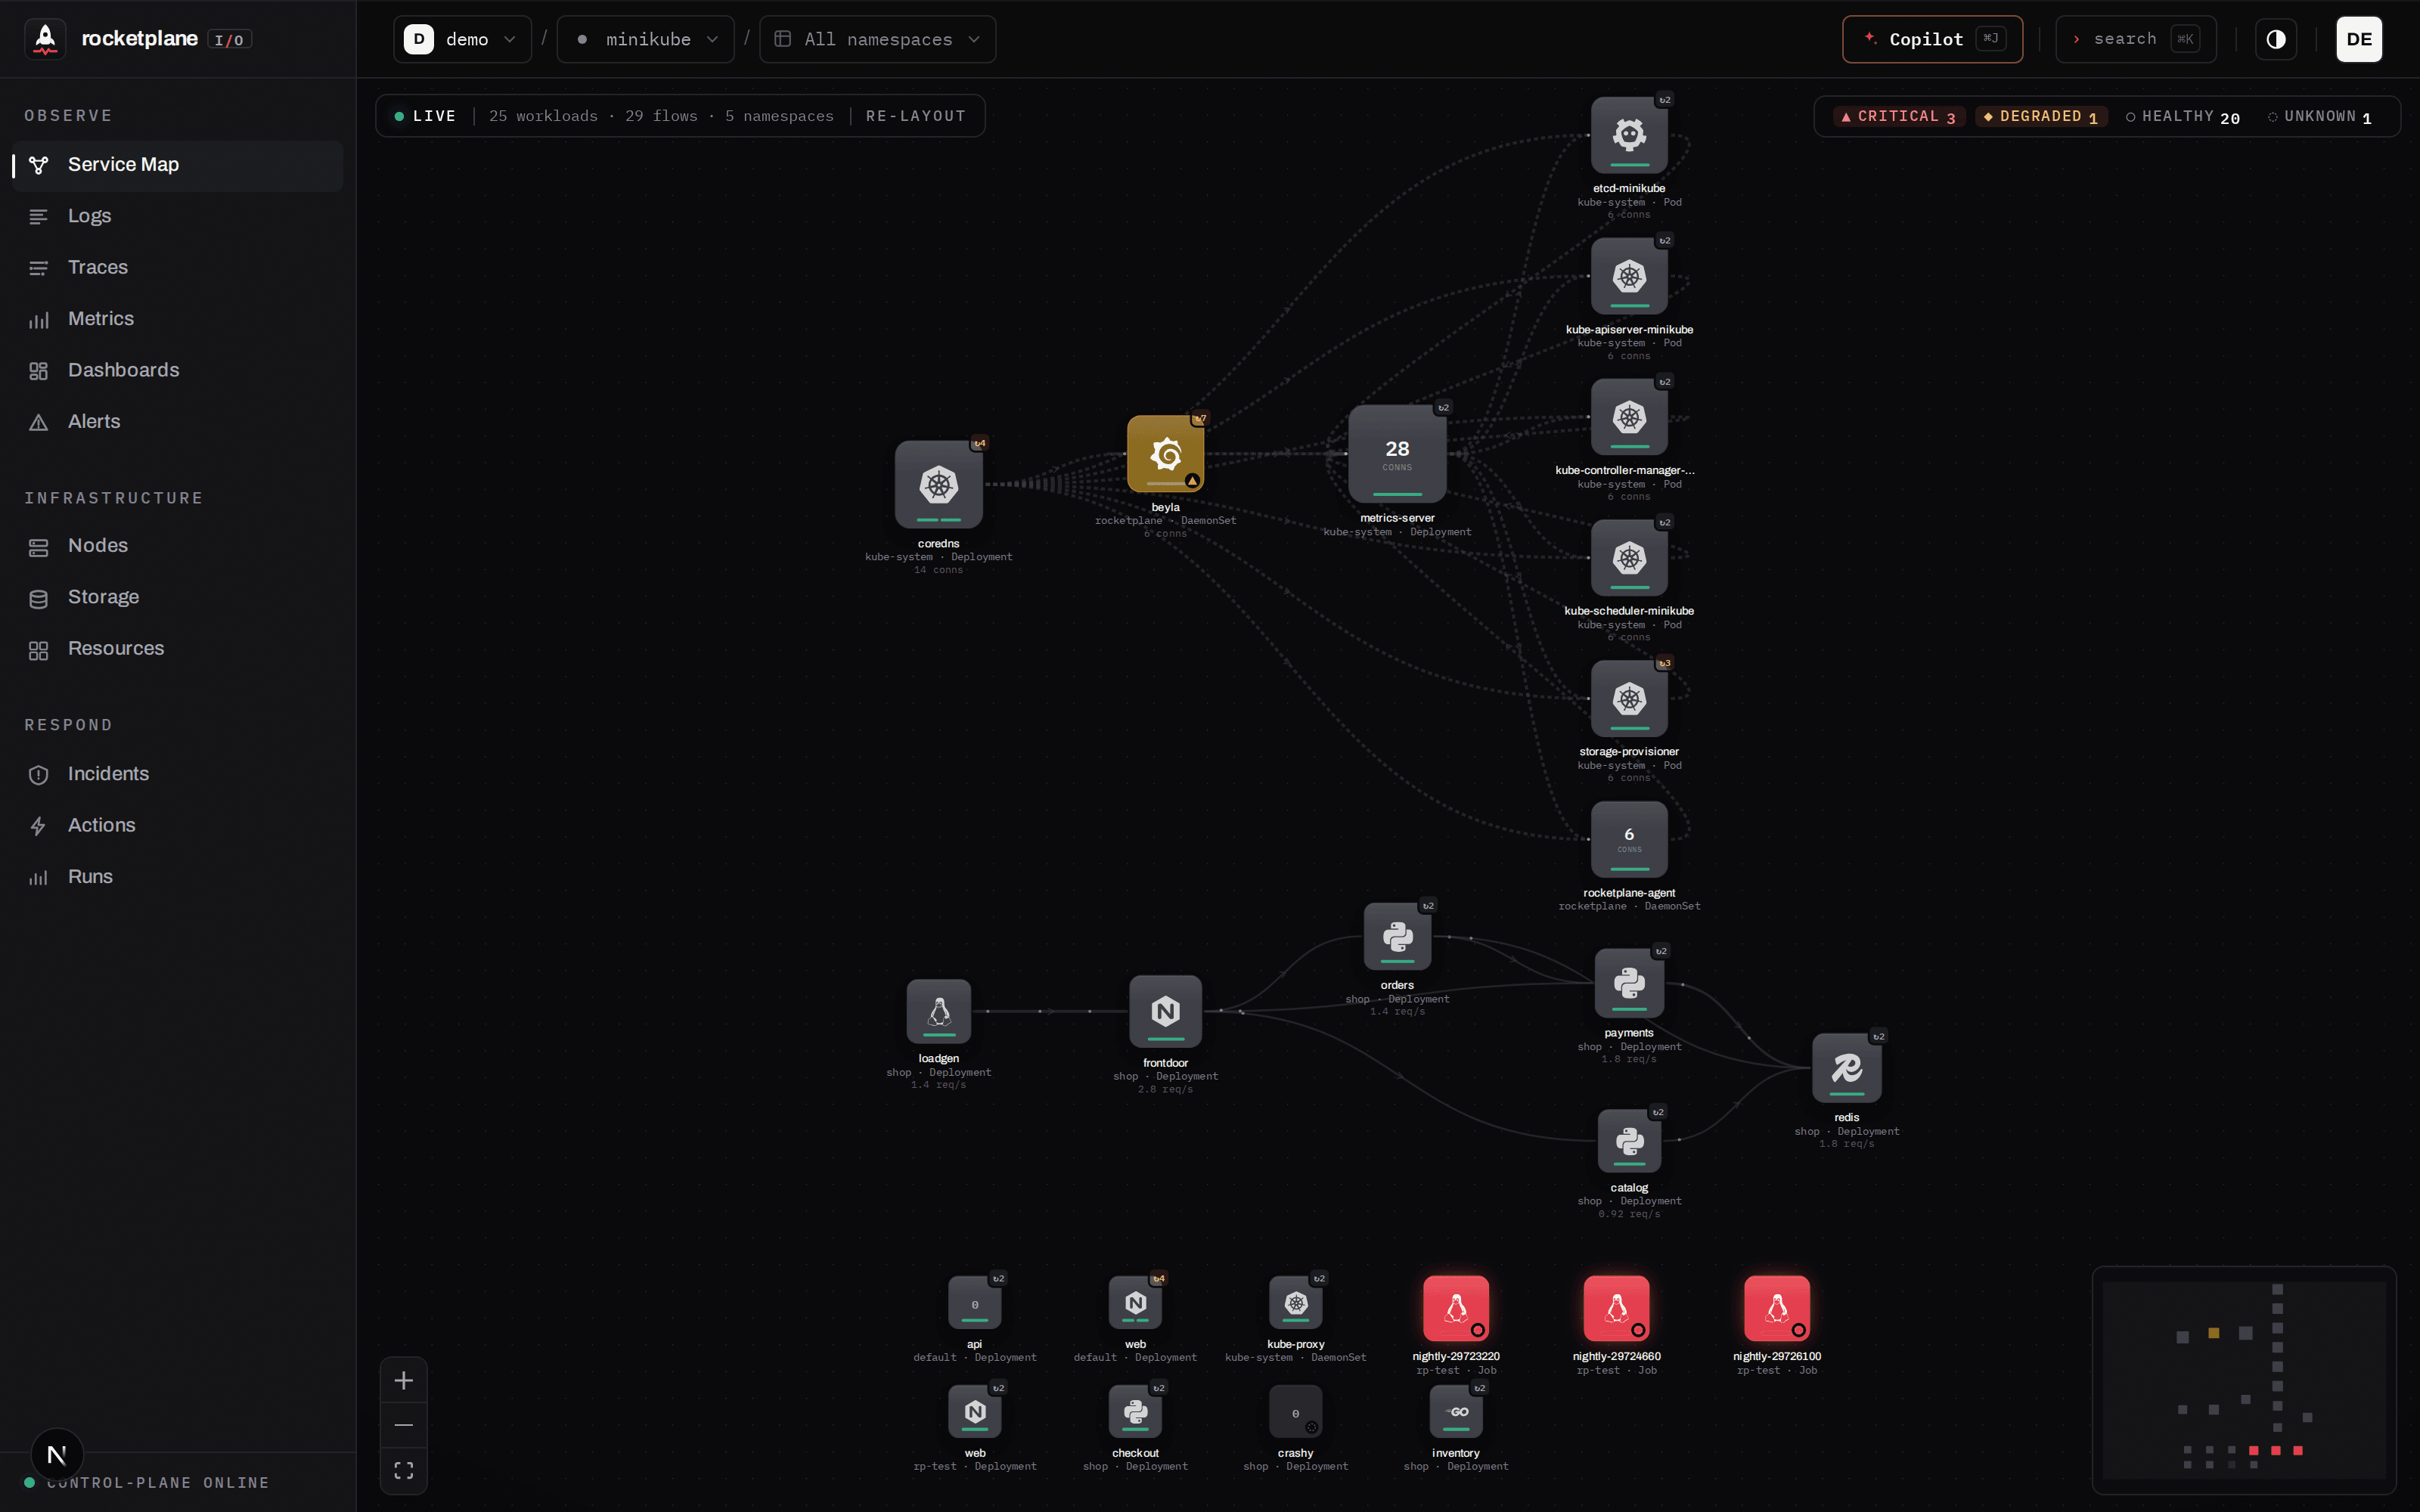
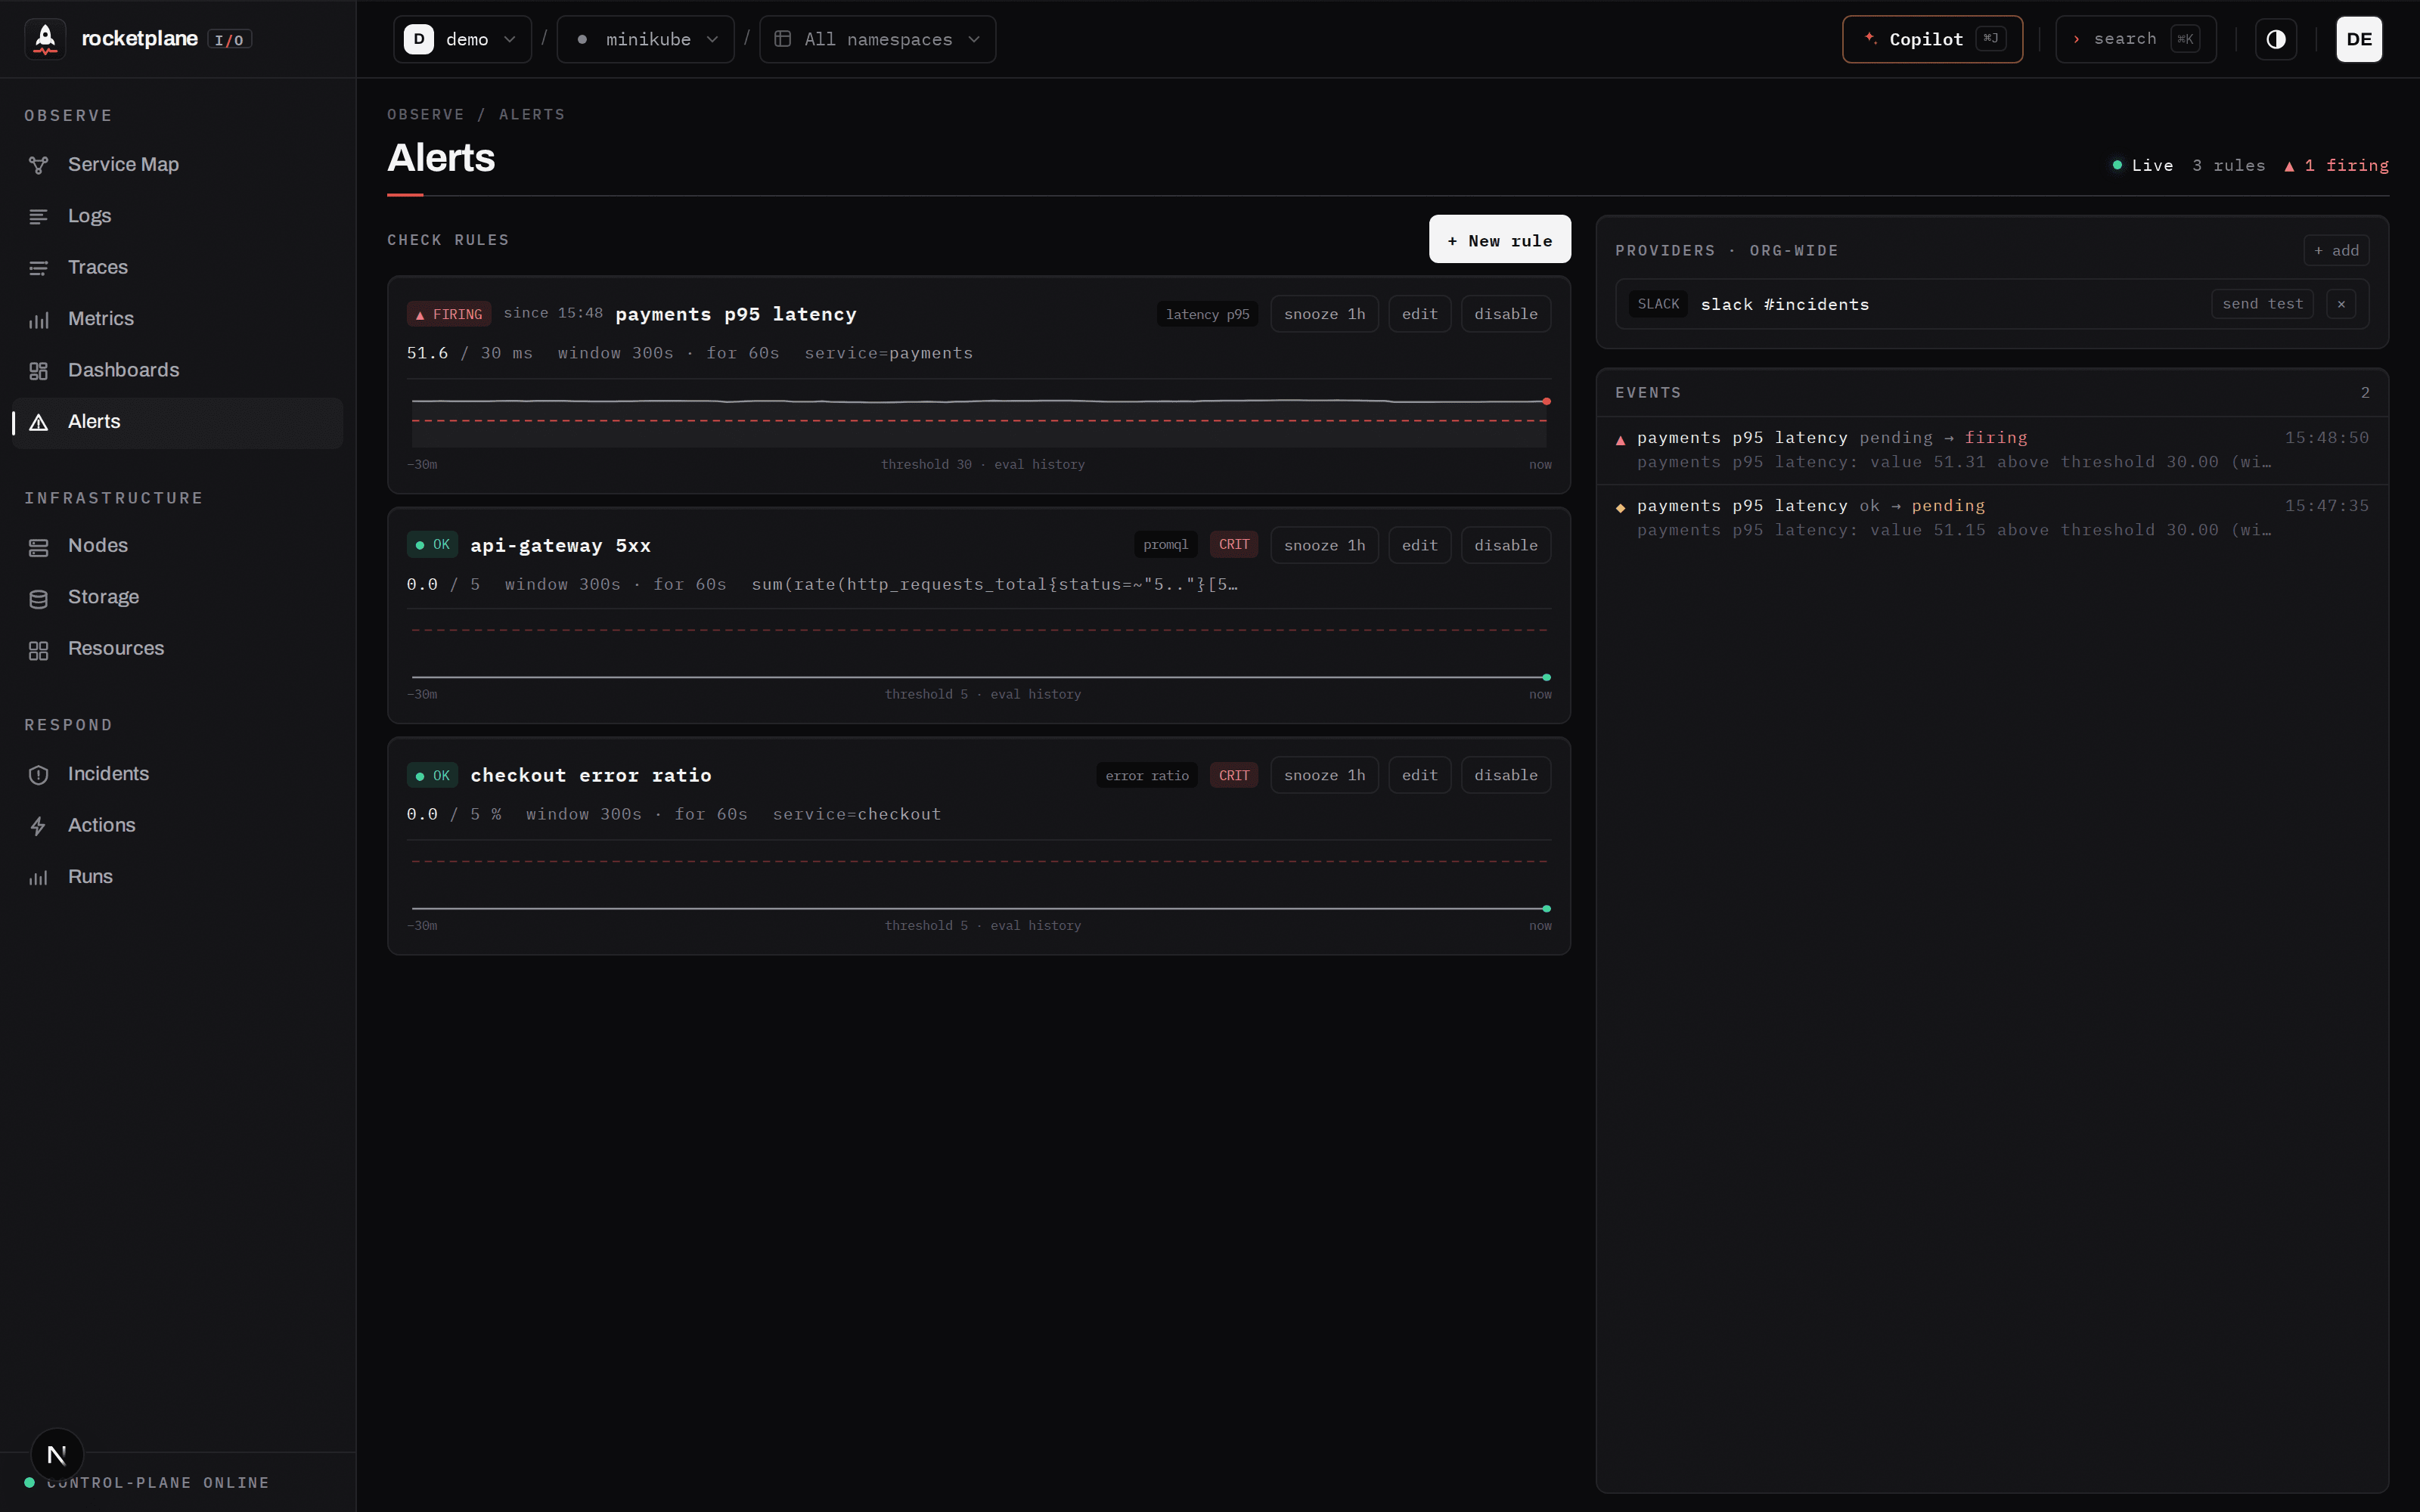
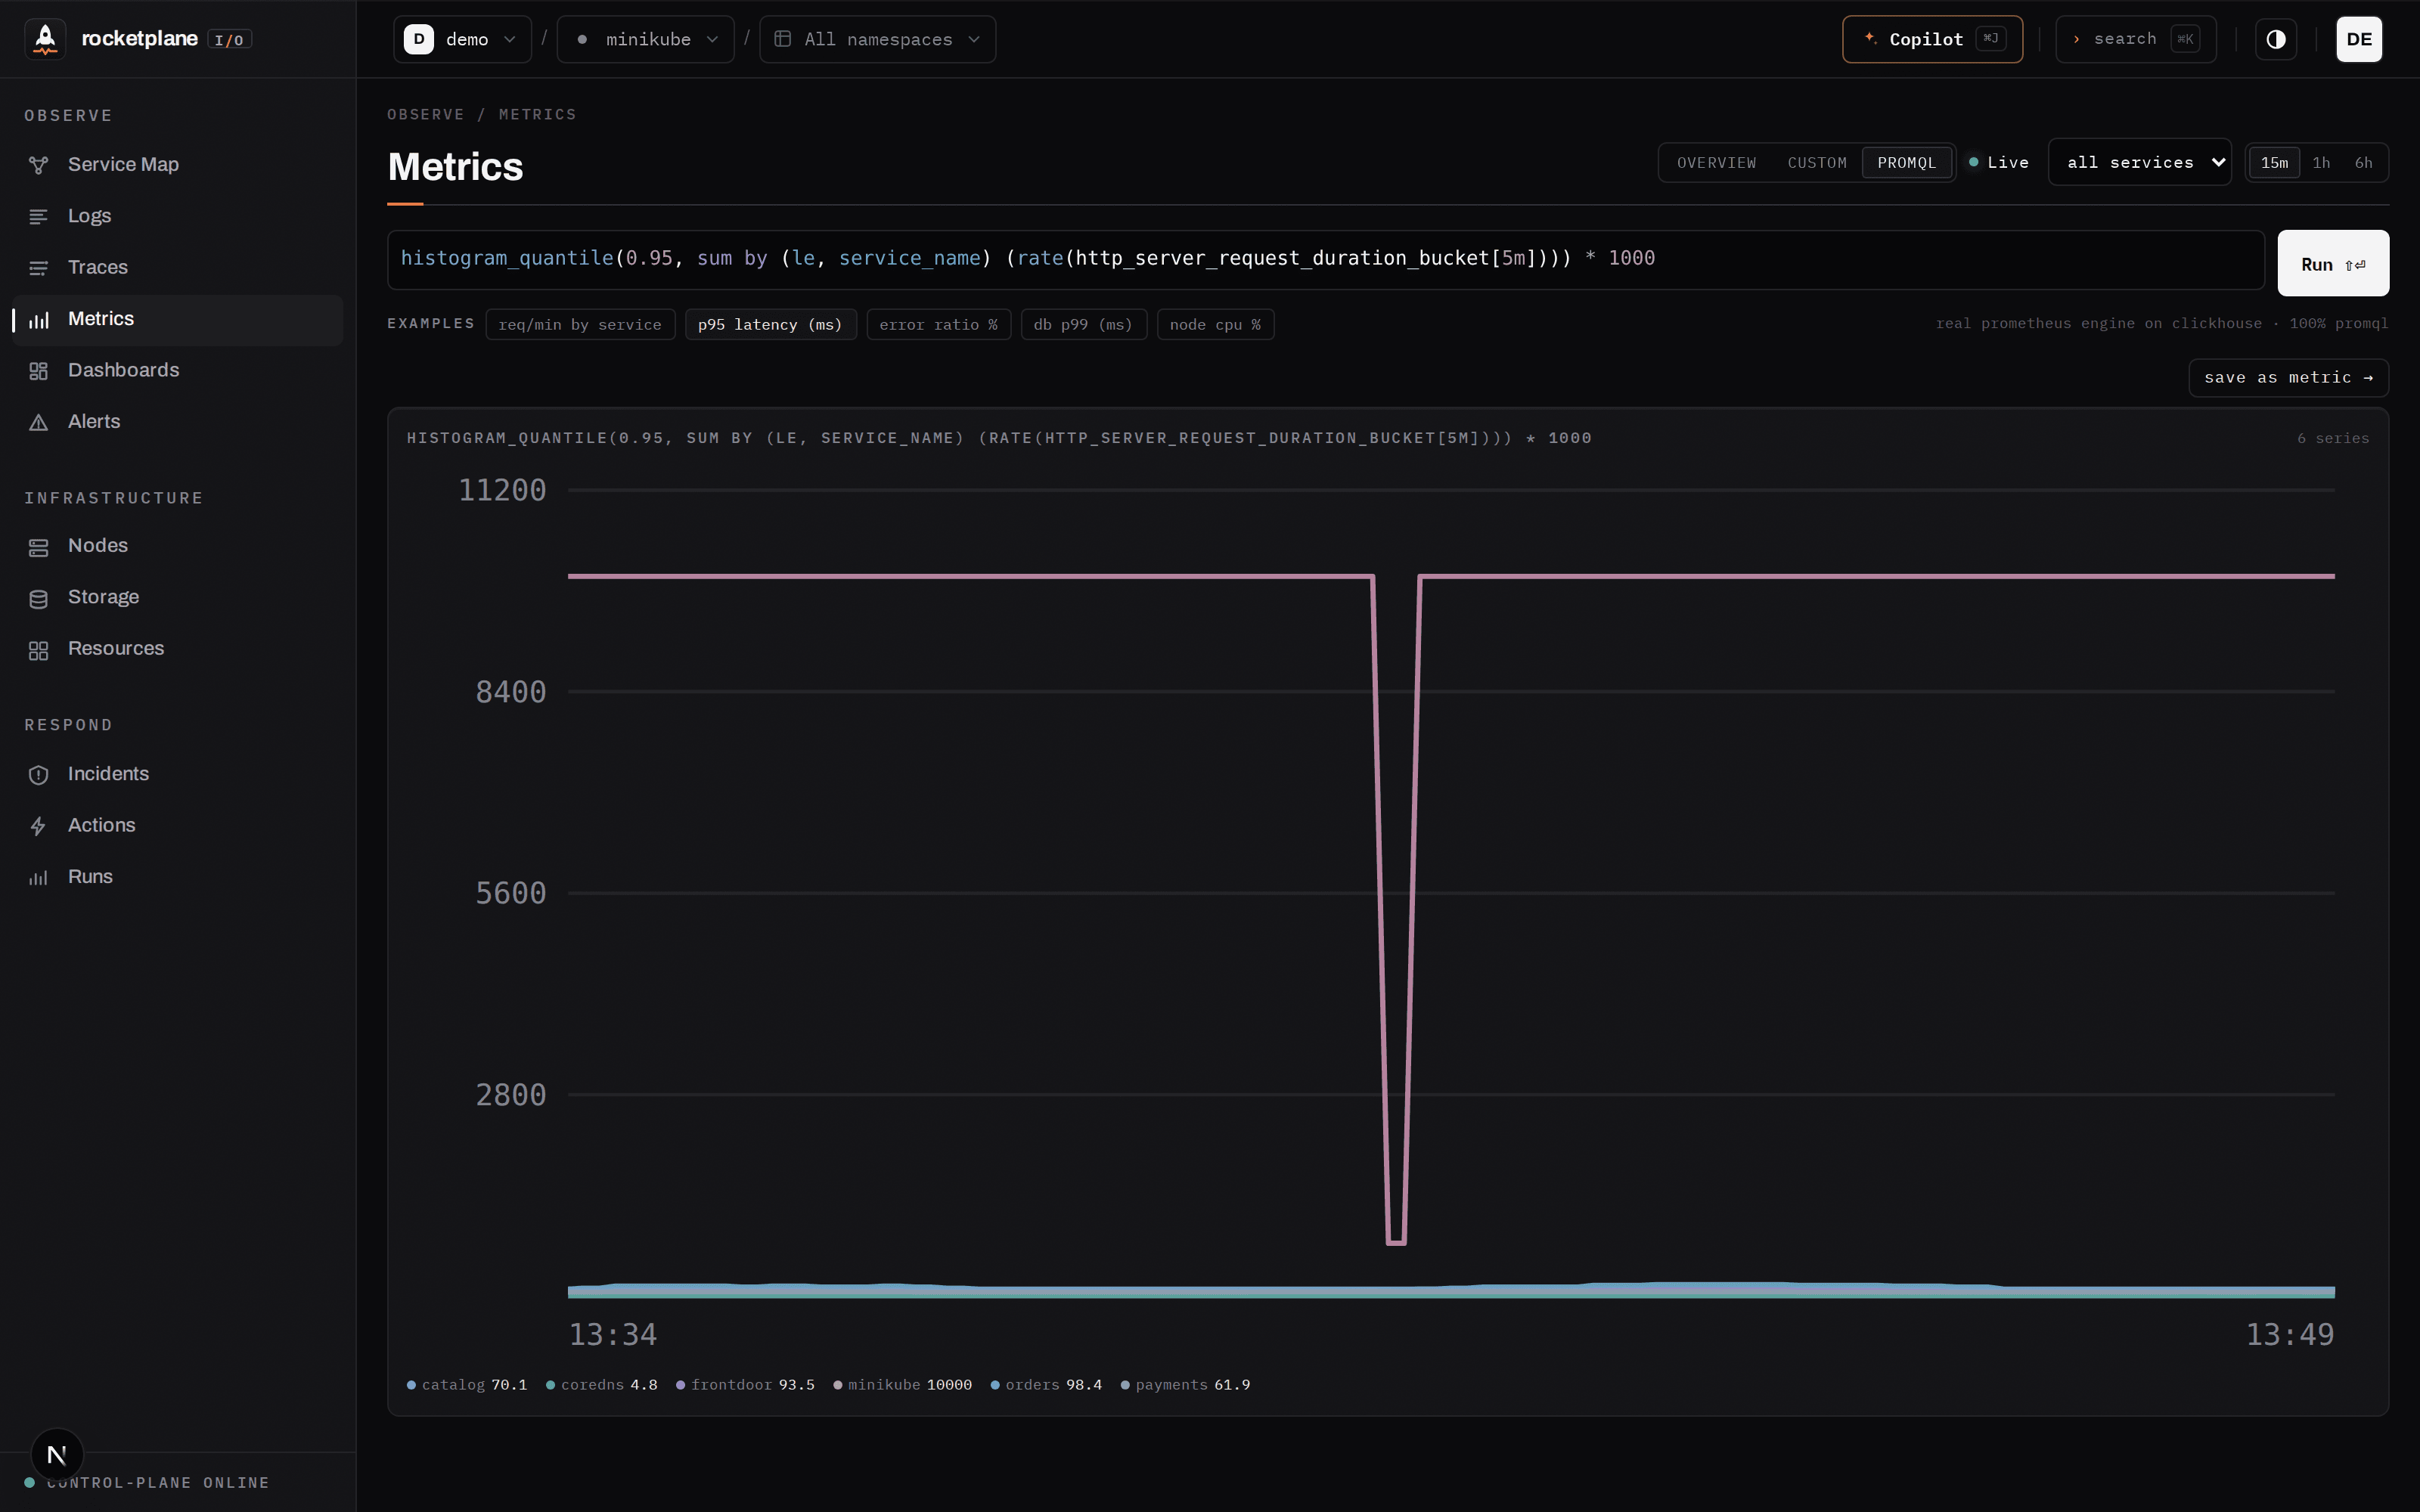
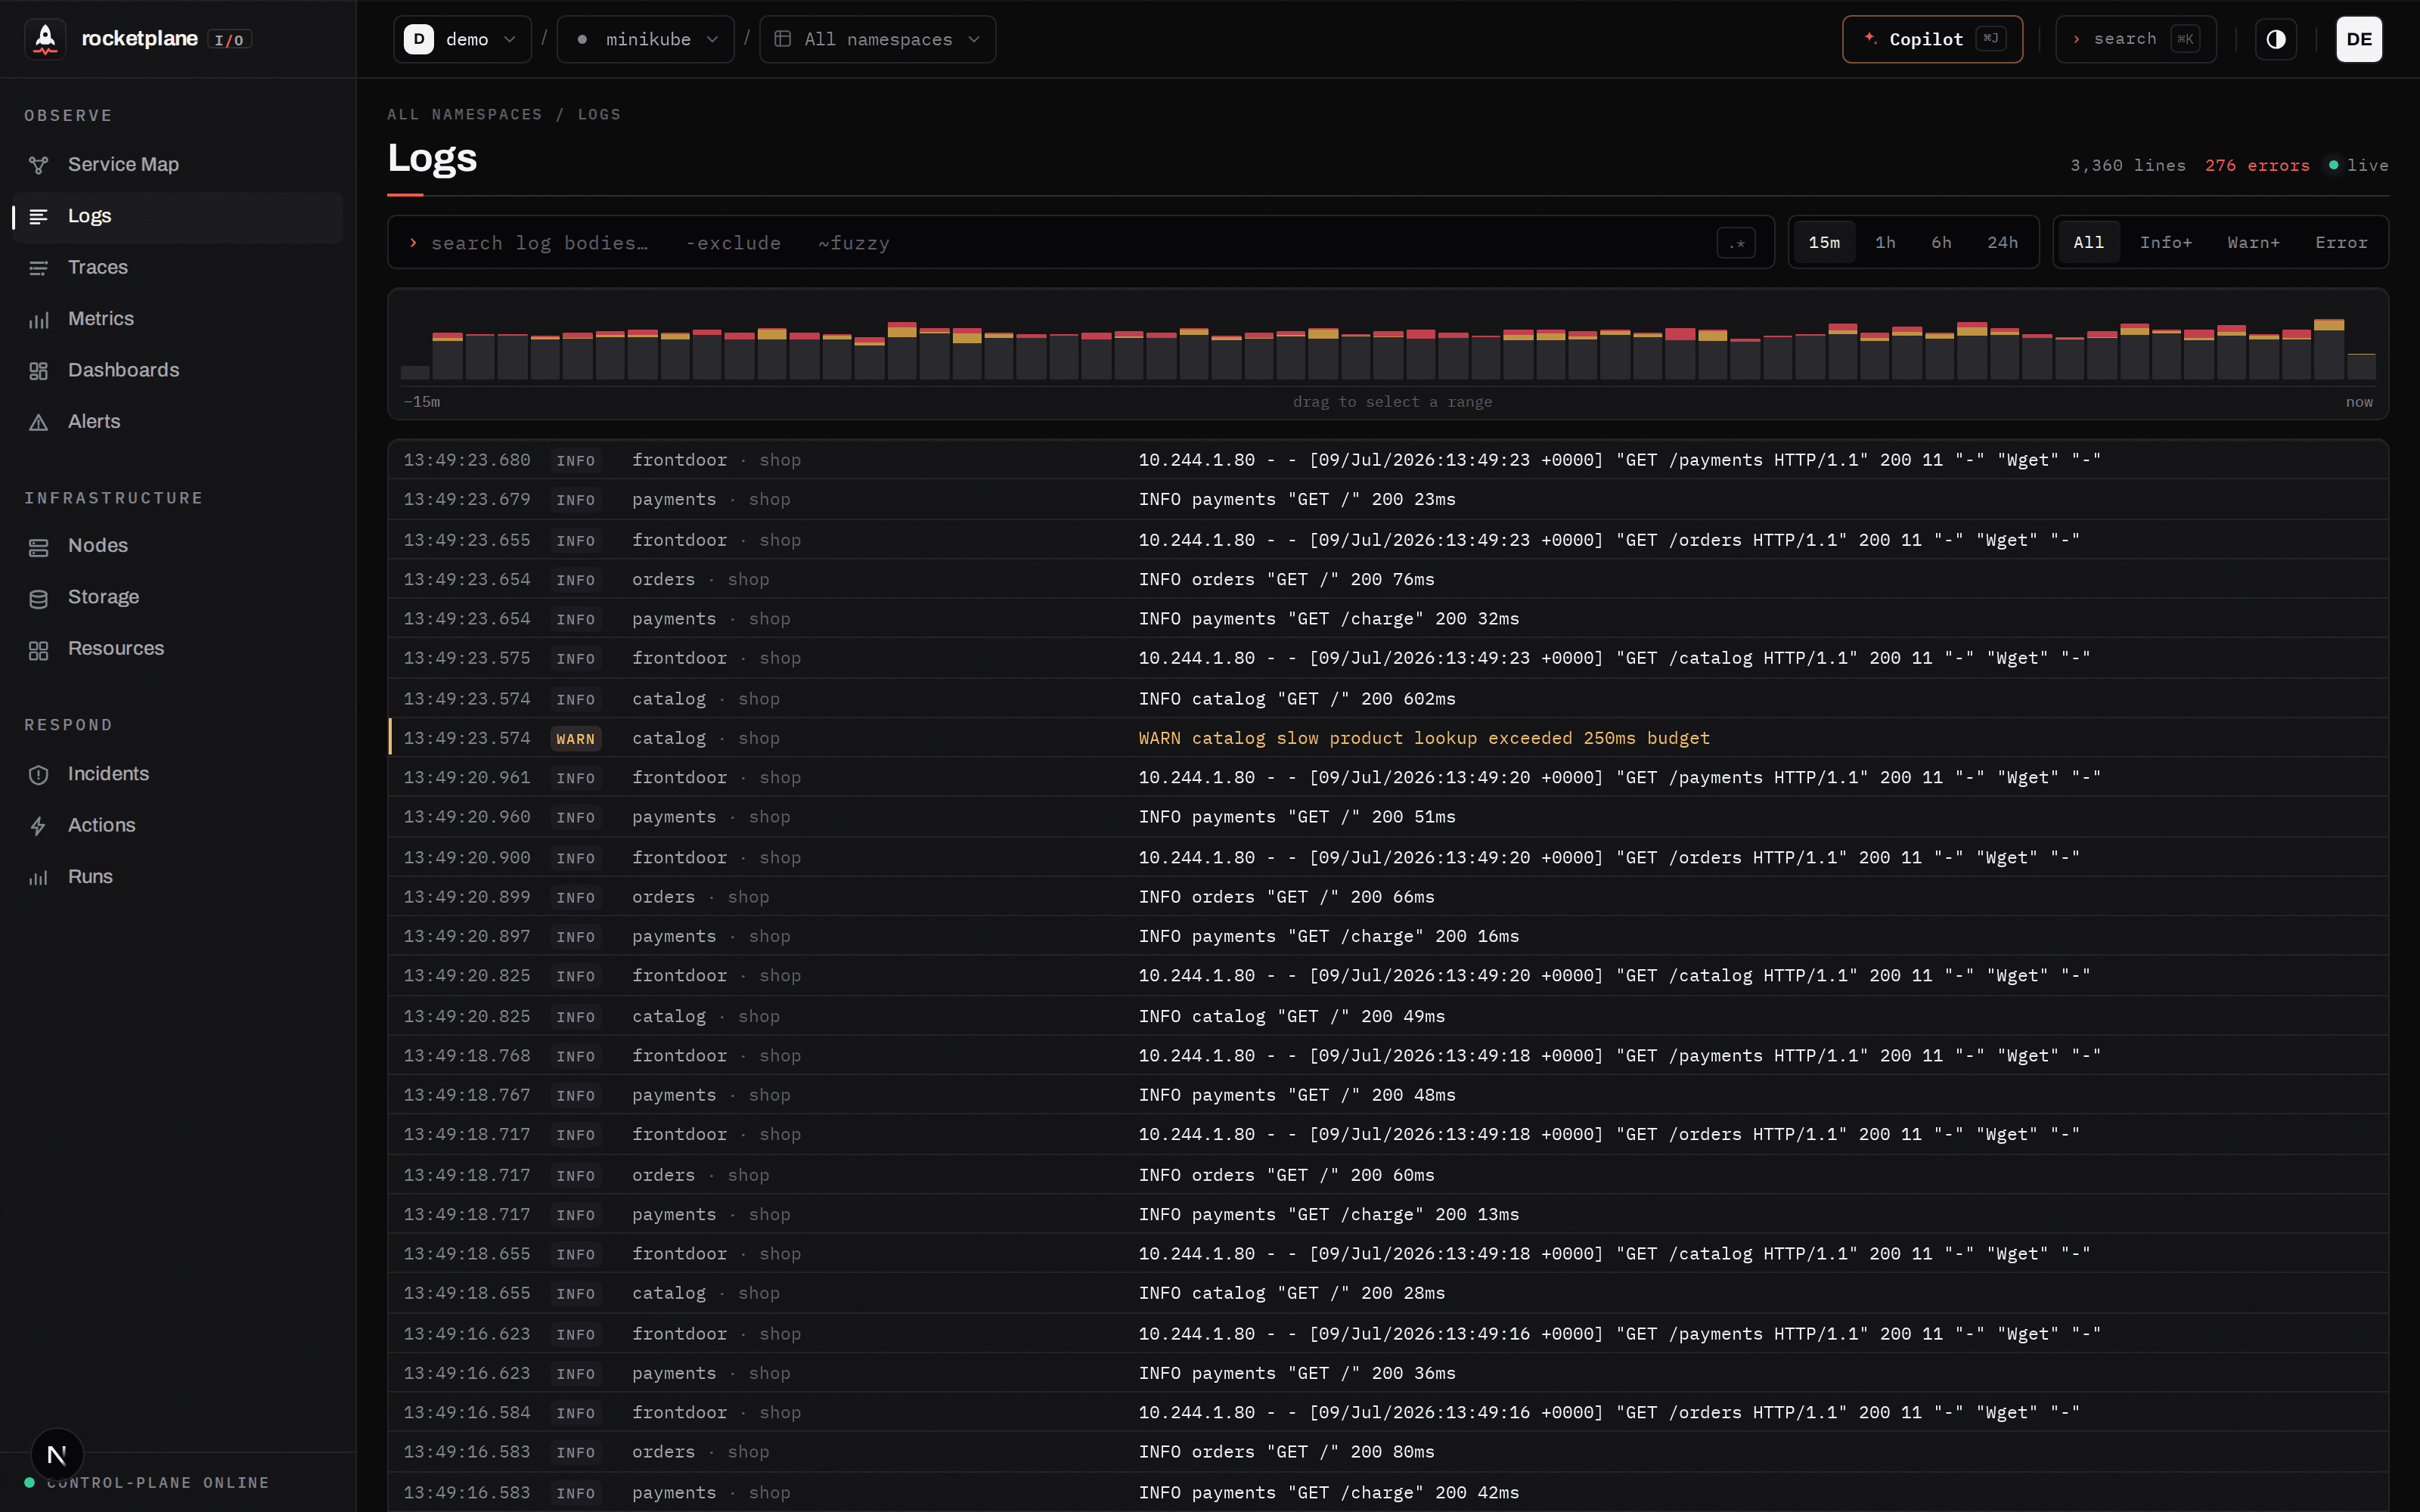
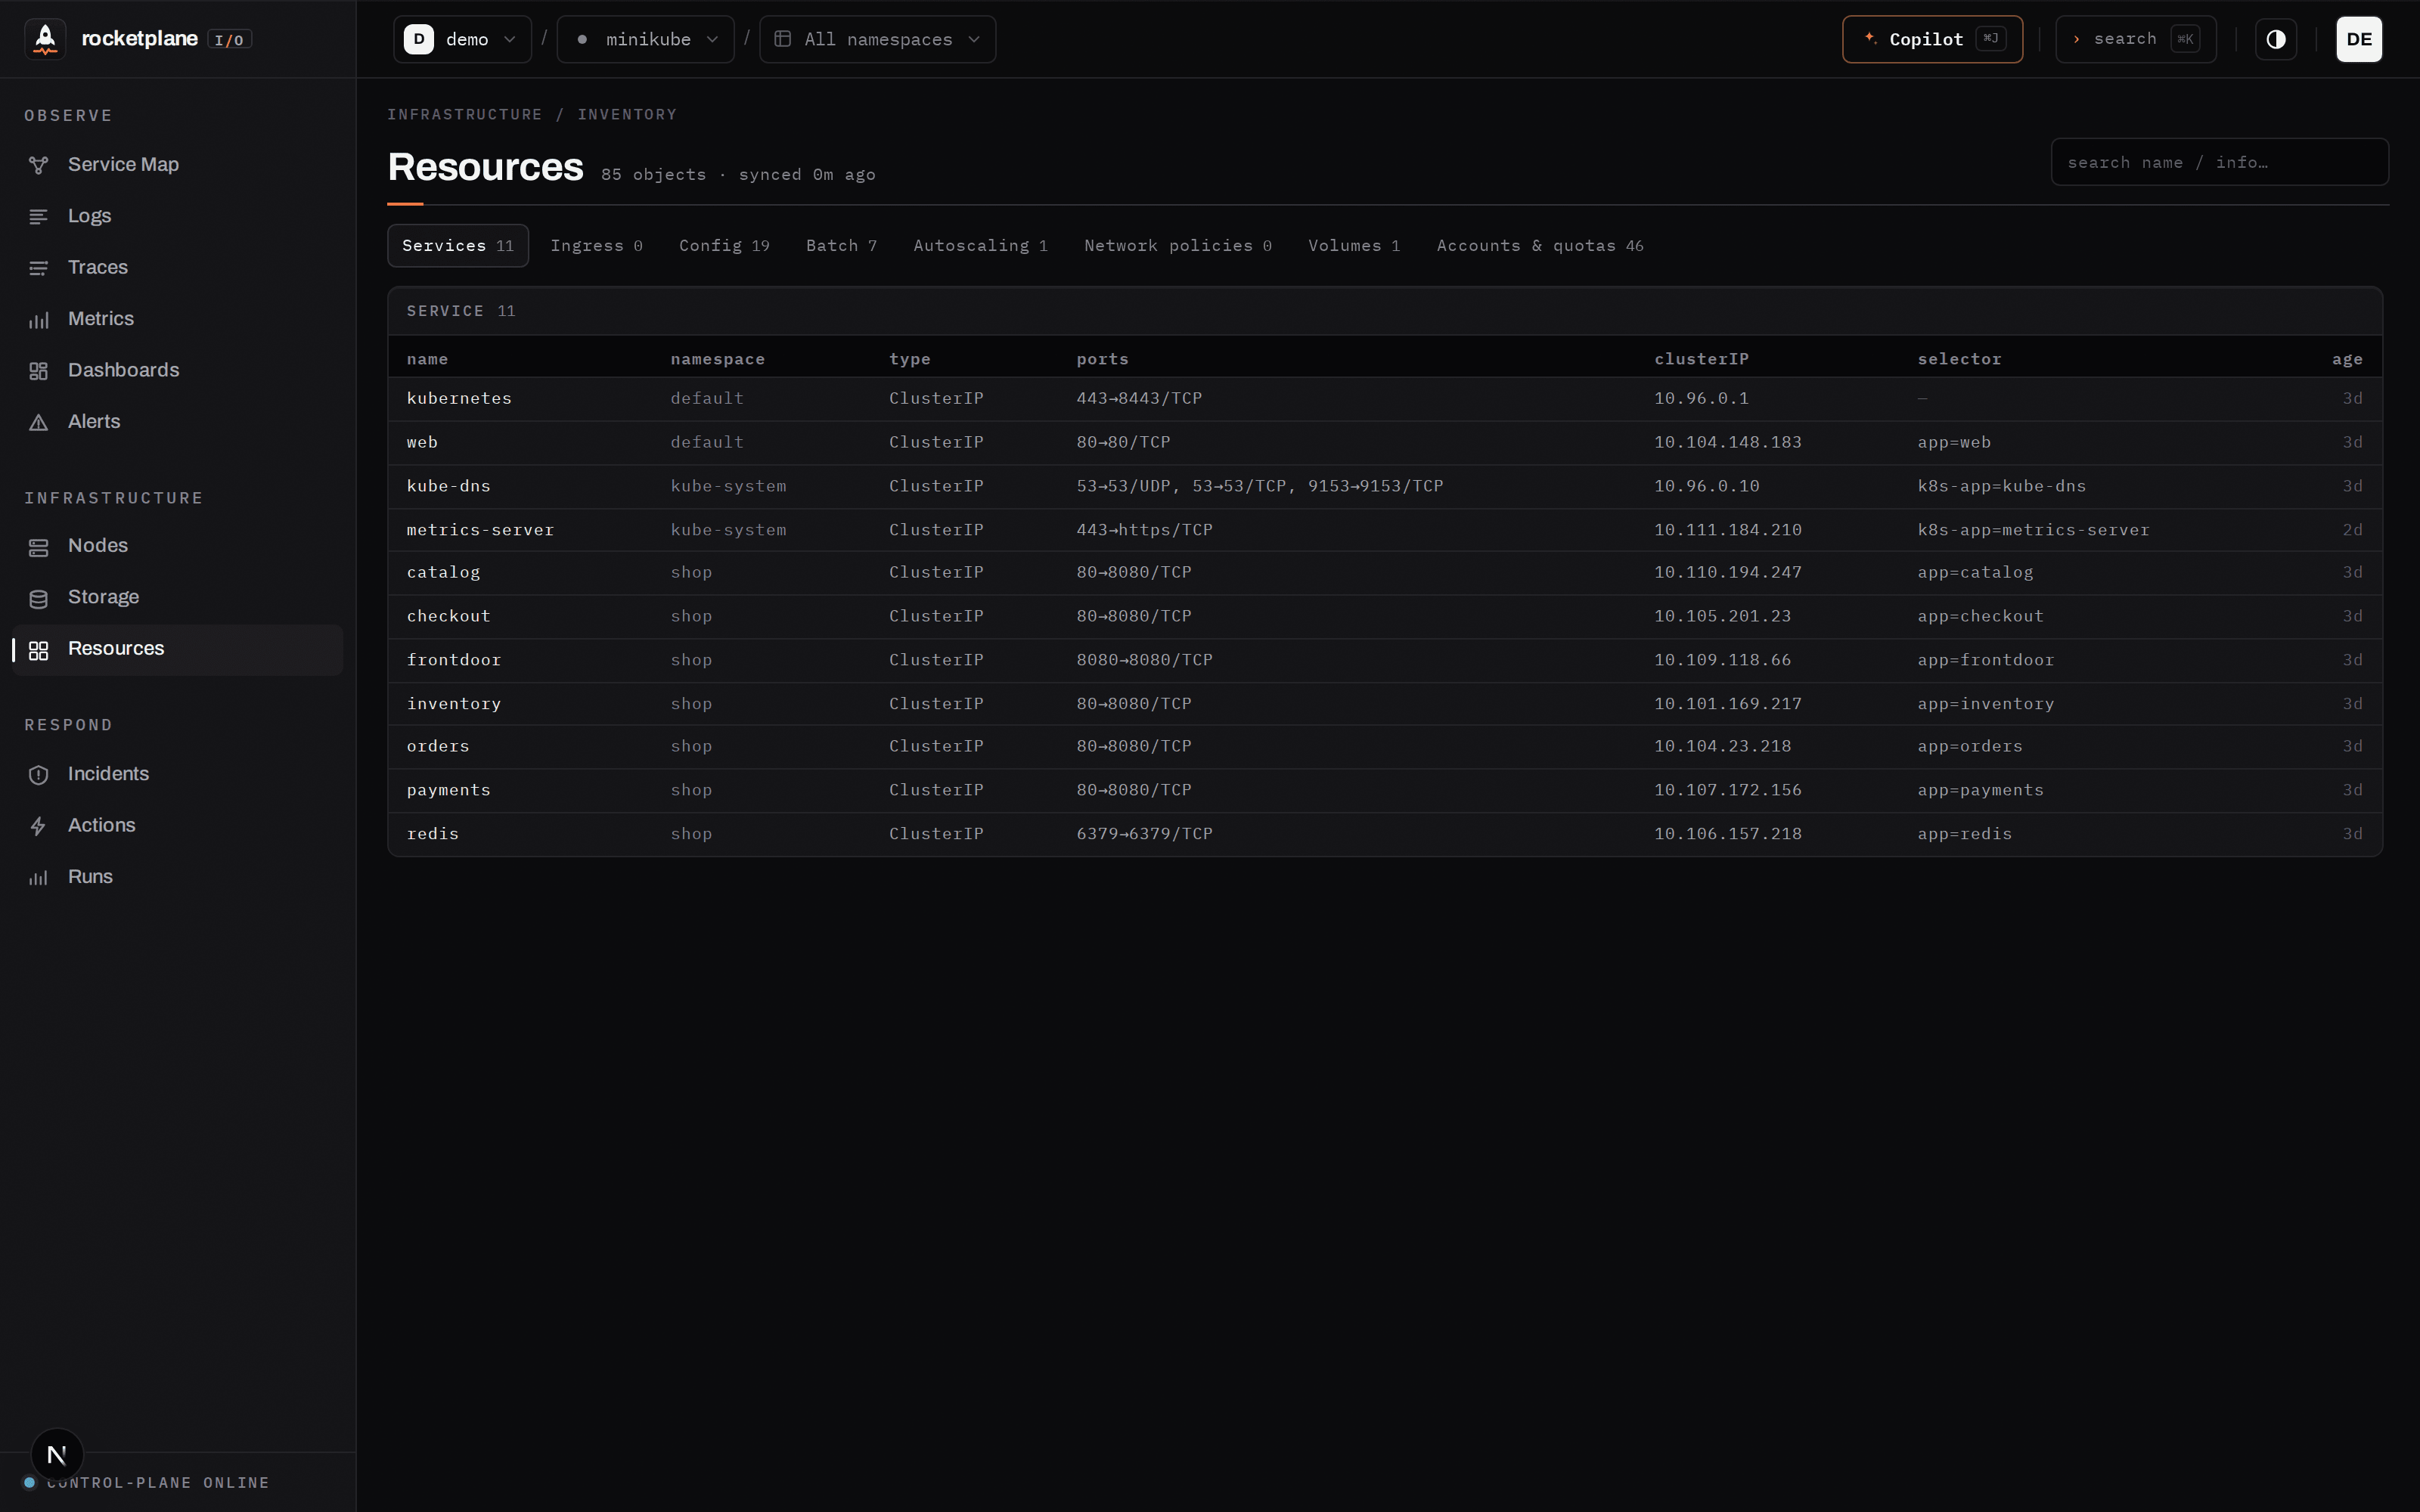
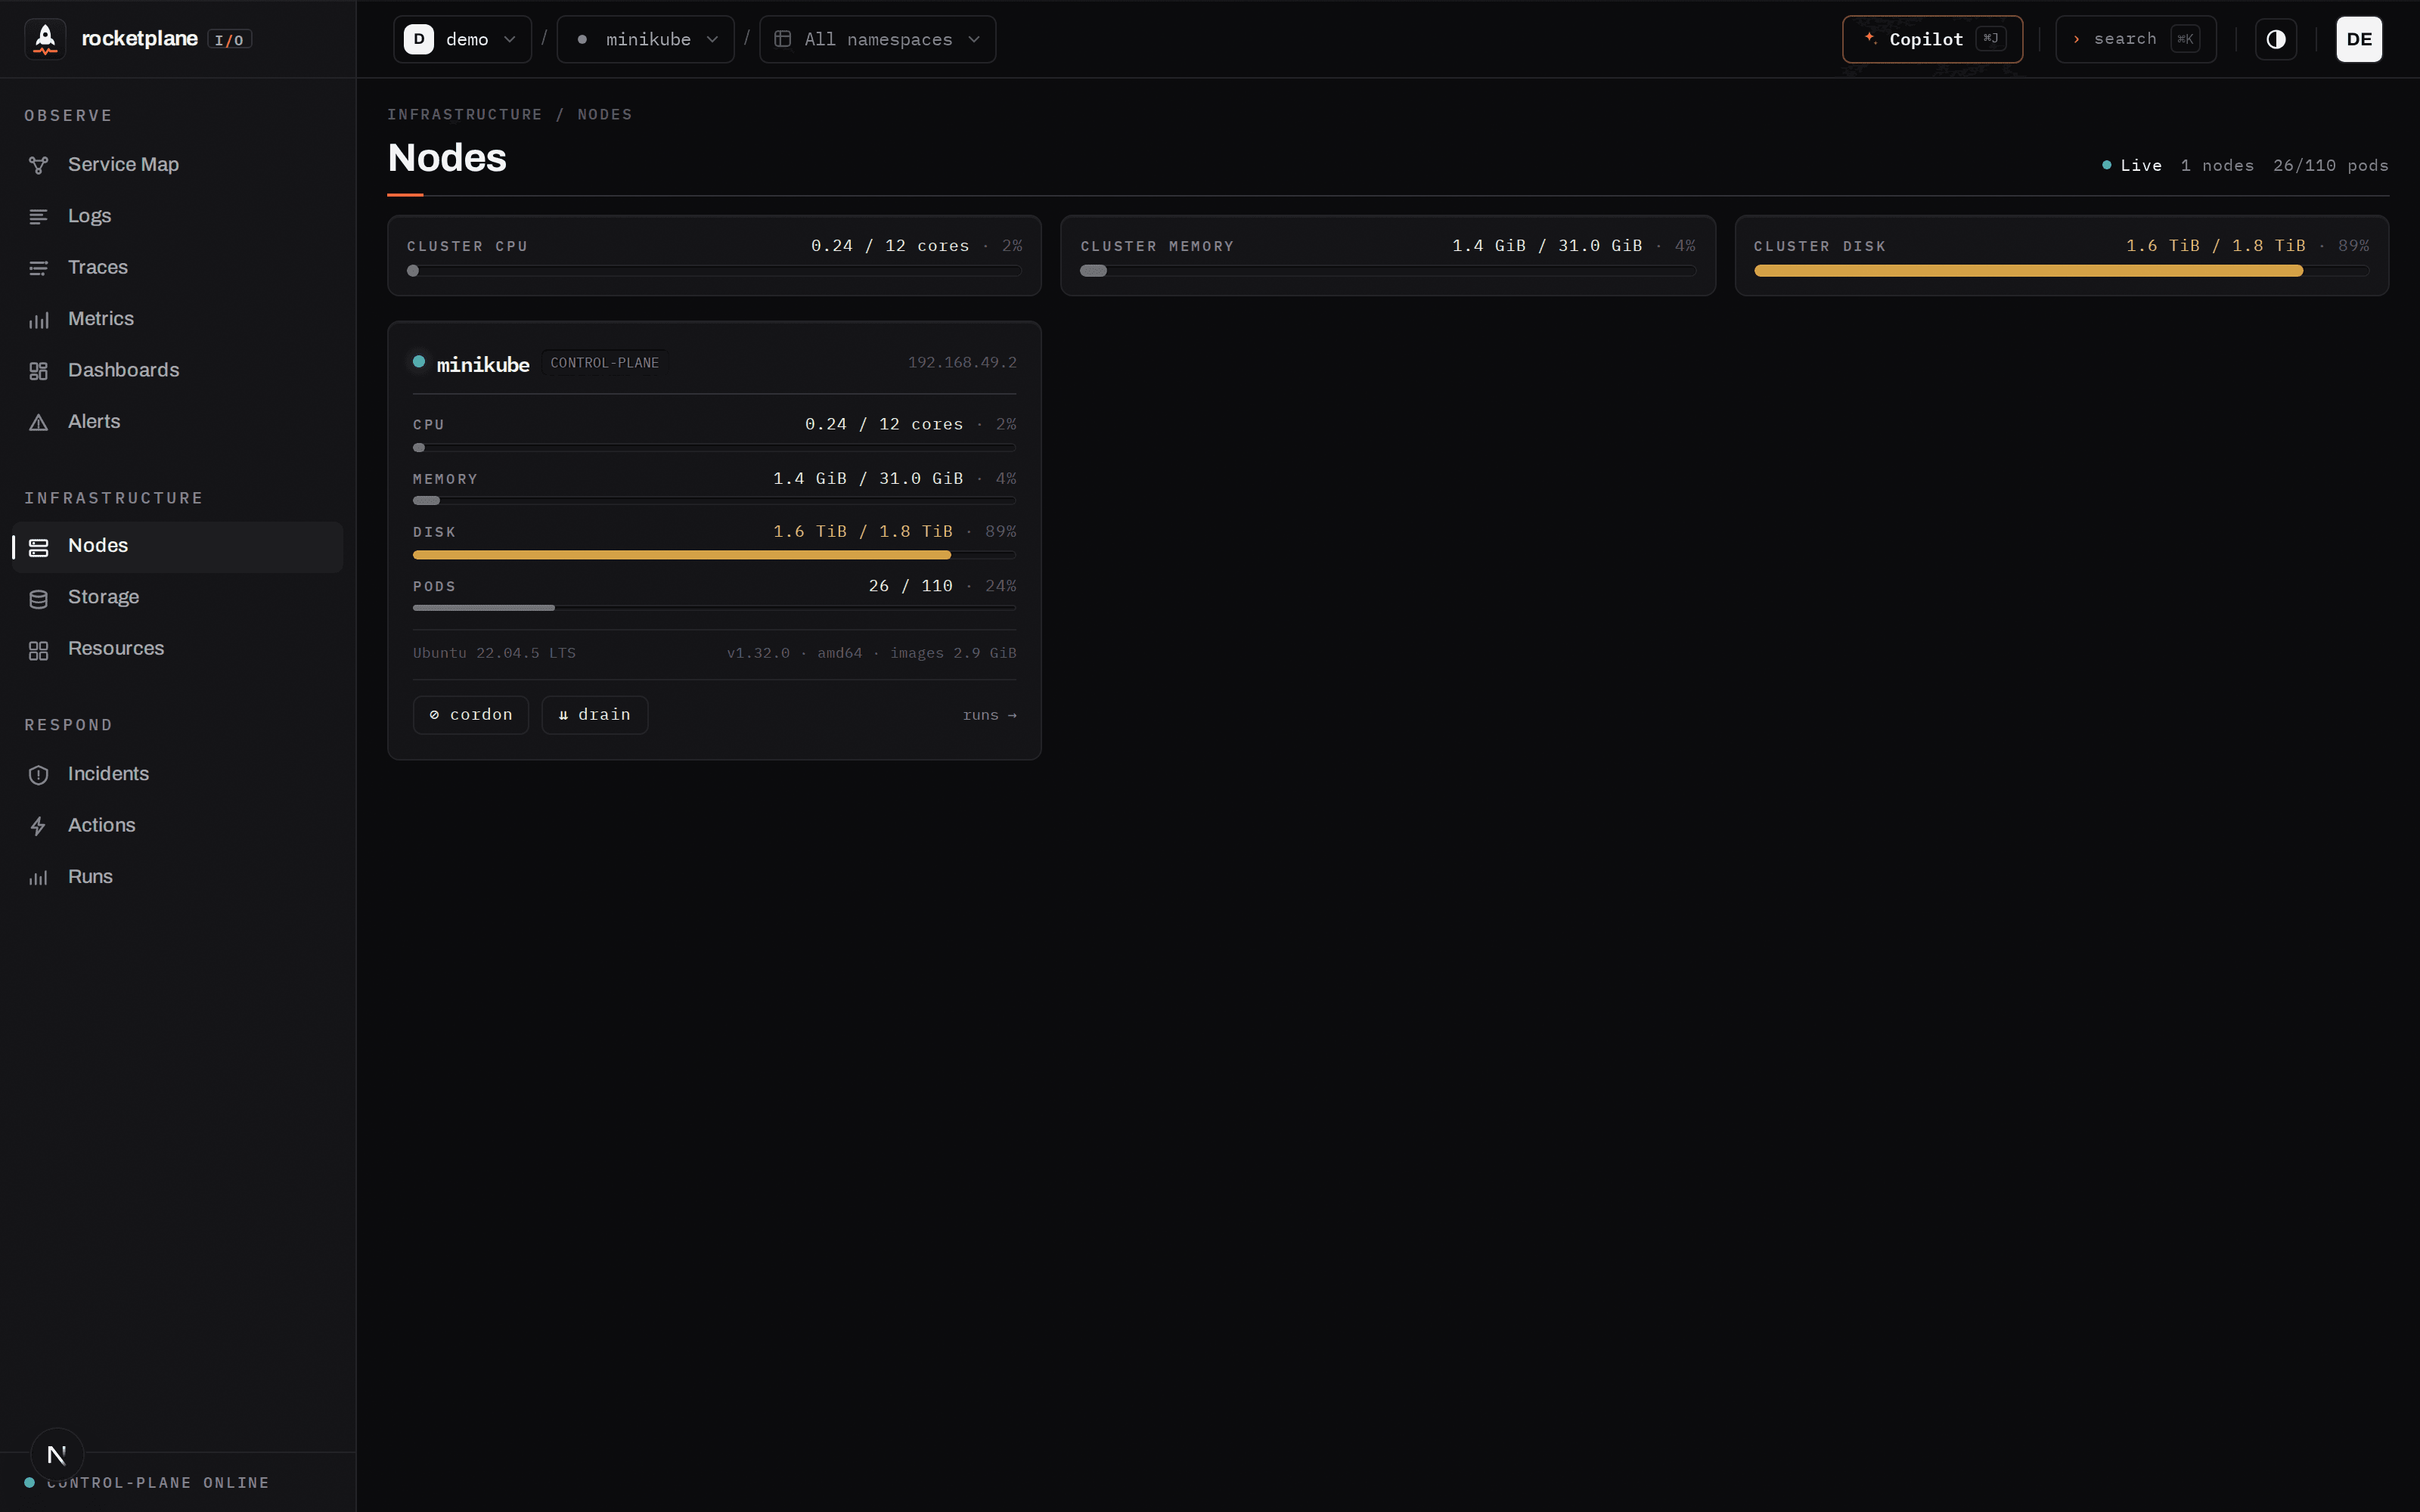
The UI follows a strict instrument-panel design system — healthy is calm, only anomalies speak.
Boring architecture, on purpose
topology · logs · inventory · action pipelines
HTTP/gRPC/Go · SQL · Redis · Kafka
Runs on Kubernetes · speaks OpenTelemetry
The Copilot is a tool-calling loop inside the control plane: eighteen read-only tools and exactly
one mutating tool, run_safe_action, which pauses the stream for human approval.
The same toolbox is exposed as an MCP server — Claude Code or Cursor can operate your
cluster through the identical guardrails.
Zero to live service map in three steps
Run the platform
needs Docker + a cluster (minikube is fine)curl -fsSL https://rocketplane.io/install.sh | shResolves the newest release from GitHub, downloads the compose bundle, generates secrets, auto-detects the address your cluster reaches the control plane at (so Connect cluster just works — no localhost trap), pulls and starts the stack. UI on http://localhost:4173. Re-running is the update path — curl … | sh again bumps you to the latest and keeps your secrets. Piping to sh is a trust decision — read the script first, it's 145 honest lines. Prefer manual, or a pinned version? The bundle lives in deploy/compose/.
Connect your cluster
Create the owner account, hit Connect cluster — one copy-paste command installs the agent and the eBPF DaemonSet. When the service map draws your namespaces and spans appear under Traces, you're live. Without touching a line of your code.
Turn on the Copilot
Connect any Anthropic- or OpenAI-compatible provider — including a local one. The key stays on your instance; requests go straight from your control plane to the provider you chose.
REPORTS FROM REAL CLUSTERS ARE THE CONTRIBUTION WE WANT MOST